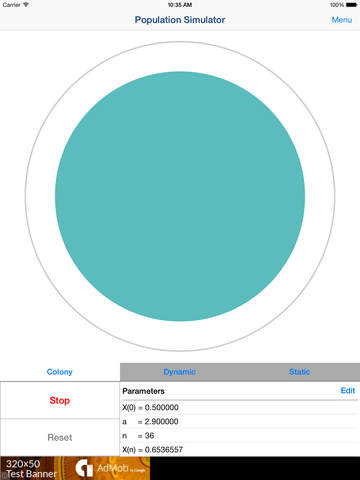
"Population simulator" is an application to visually see the changes in the population by using "Logistic Map".You can see the change in the population by the Logistic Map by a line graph and colony size.You can observe the variation pattern of population variety by changing slightly the initial value.Logistic Map is not only used in Population Ecology but also considered one of the starting point of Chaos Theory. I developed this app to help people who are studying Population Ecology or Chaos Theory.*Logistic Map may not necessarily apply to changes in population of actual organisms, because Logistic Map is a model of a simple change of the population.■What is Logistic Map?The Logistic Map is the map that is generated from the Logistic Function that has been devised as a variation model of the population of an organism.It is expressed by the following function.X(n+1) = a・X(n)・(1-X(n))In the above equation, the meaning of each symbol is as follows.・n:Generation (n=1,2,3,...)・X(n):Value obtained by normalizing the Population of Generation n-th(0≦X(n)≦1)・a:Value obtained by normalizing the Reproductive Rates(0≦a≦4)You can calculate the population of the next generation from a population of a certain generation by using this function. In addition, You can predict the variation of the population over the long term by calculating the population of individuals repeatedly in this function.■Pattern of Logistic MapLogistic map vary widely depending on the value of "a".・In case (0≦a≦1) → X(n) converges to 0.・In case (1<a≦2) → X(n) converges to 1-(1/a).・In case (2<a≦3) → X(n) converges to 1-(1/a) while oscillating.・In case (3<a≦3.5699456・・・) → X(n) oscillate between the periodic point individual Power of 2・In case (3.5699456・・・<a≦4) → X(n) Change irregularly.(Chaotic region)*It may become periodically by the value of a.Please try to observe the changes of Logistic Map by changing the various initial values.■Main function of App1. Simulation of changes in colony size2. Line graph of changes in population3. Output CSV file(Need to purchase add-on.)4. Output Graph Image(Need to purchase add-on.)


免費玩Population Simulator - Population Model Simulator with Logistic Map for Ecology And Biology - APP玩免費
免費玩Population Simulator - Population Model Simulator with Logistic Map for Ecology And Biology - App
Population Simulator - Population Model Simulator with Logistic Map for Ecology And Biology - APP LOGO

Population Simulator - Population Model Simulator with Logistic Map for Ecology And Biology - APP QRCode
| 熱門國家 | 系統支援 | 版本 | 費用 | APP評分 | 上架日期 | 更新日期 |
|---|---|---|---|---|---|---|
| 未知 | iOS App Store | 1.2 App下載 | 免費 | 2014-05-30 | 2015-06-04 |