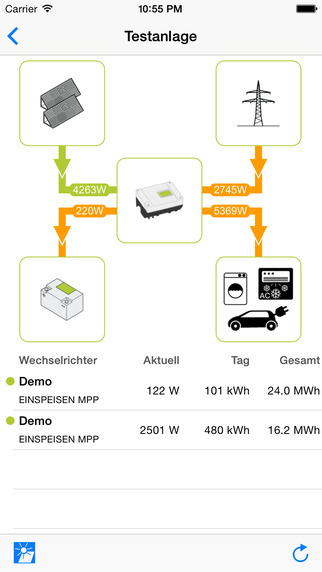
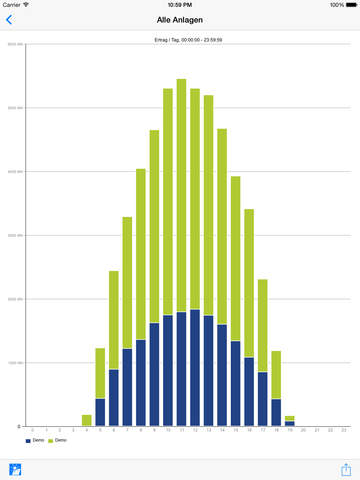
Using the PIKO Solar App, customers will soon be able to monitor their systems easily via their smartphone or tablet – naturally free of charge. Here you can view important data from your PV system in a graphic display. For example, you can monitor your DC yield and see how much electricity you’re feeding into the grid. If you have one of the latest PIKOs and the PIKO BA sensor, you’ll also be able to see how much electricity is being used in your building. With the PIKO BA system you can even see how much of the electricity you are producing is being fed into the battery or being used from the battery. Besides this live data, which is updated via WLAN or DynDNS, you can also display past yields i.e. from yesterday or last week as a diagram. The PIKO Solar App is available for the Android and iOS operating system. Settings After installing one plant has to be created by specific system information under the item “Settings” - “PV plant”. In the next step you have to add an inverter under the item "Inverter", which can be reached via the inverter name or IP address of the device. In order to view the historical data, the values for the web interface usernames ("pvserver") and the password (default "pvwr"), as well as the web interface HTTP port (default "80") and the RS485-adresse/port s (standard "255") must be entered. After assignment to a facility and the storage the live data of the production from the PV system can be displayed. Thus, the income may be converted into a monetary value, the respective remuneration must be entered. To also retrieve and display nor the historical data, it is necessary to enable the checkbox "Historical Retrieving data" the inverter settings of the app. If you have replaced or renewed an inverter, you can make a correction in earnings (kWh) in the app settings of the inverter.Live dataIn the "Live Data" you can see the current power data of the choosen plant (on the top left next to the app logo) and the self consumption in combination with the PIKO sensor.An update occurs every 5 seconds. By clicking on the respective symbols following values are visible in the menu "Live Data":Inverter- Current power (W)- Current feed-in of the individual phases (W)- Efficiency of the plant in kWh/ €PV Generator- Current of the individual DC strings (W)- Total power of the DC strings (W)AC power supply - Inverter power (W)- Self consumption (total)- Difference between yield and consumption (W)Self consumption- Total self consumption (W)- Coverage by inverter, battery and grid (W)Battery- Charging status of the battery and the actual power (W)- Voltage, discharge current, temperature and number of cyclesBelow the overview of live data you will find a summary of the respective inverter.HistoryAt "History" you can retrieve on the "Measure" menu of the income, the battery and domestic consumption values for the "periods" day, week, month, year and total. After selection of the desired parameters and the time period, the information must be confirmed with "Show Data".ContactThe menu item "Contact" allows you direct contact with our support. If you want to attach the technical data of the inverter to the e-mail, you have to enable the checkbox "Technical information send them along" and confirm the "Submit" button. In the following, an email will be sent to the KOSTAL Service through your e-mail program.
免費玩KOSTAL - PIKO Solar App APP玩免費
免費玩KOSTAL - PIKO Solar App App
| 熱門國家 | 系統支援 | 版本 | 費用 | APP評分 | 上架日期 | 更新日期 |
|---|---|---|---|---|---|---|
| 未知 | iOS App Store | 1.03 App下載 | 免費 | 2015-03-04 | 2015-06-03 |


