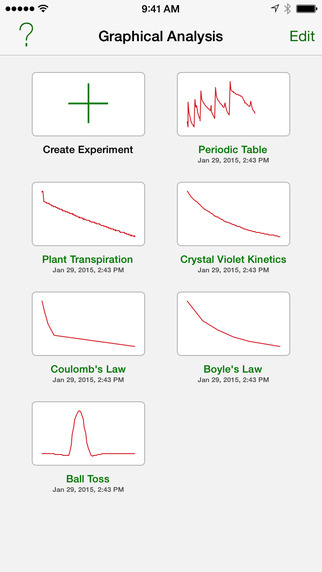
Students use Graphical Analysis to wirelessly collect, analyze, and share sensor data in science and math classrooms. Graphical Analysis facilitates student understanding with real time graphs of experimental data. Students enhance their work and lab reports with easy annotations, statistics, and curve fits.Wireless capabilities:Connect to Go Wireless sensors or NODE directly. Using LabQuest 2 or a computer running Logger Pro as a Data Sharing source, connect each member of a lab group while collecting data from any of over 70 compatible Vernier sensors.Students can collect data from built-in accelerometers or manually enter data into a table, then use Graphical Analysis to analyze and share the data.Export data and graphs to create a lab report or send their finished work to the teacher. Export graphs to the Camera Roll, Mail, note-taking apps, or print via AirPrint. A CSV file of the data can be exported to third-party apps or to other users via Mail, Messages, or AirDrop.Key features:• Enter data in a table with row-by-row entry and multiple columns.• Display 1, 2, or 3 graphs.• Auto-save experiment data, graphs, annotations, statistics and curve fits.• Draw predictions on a graph.• Pinch and stretch to scale the graph.• Tap or drag to make selections on the graph.• Perform curve fits, including linear, quadratic, natural exponent, and more.• Create text annotations.• Export graphs and data.• Import CSV data files.• Import from Vernier data-collection software: Logger Pro 3 (cmbl), Graphical Analysis PC/Mac (ga3), Logger Lite (gmbl) and LabQuest (qmbl).• Start with sample data and experiments or analyze patterns in the periodic table of the elements.Additional features (Hardware required):• Collect and analyze sensor data with Go Wireless Temp, Go Wireless pH, and Go Wireless Heart Rate• Collect from over 35 Vernier sensors with Go Wireless Link.• Collect and analyze motion data with NODE sensor platform.• Collect and analyze data for temperature, light, humidity, barometric pressure and CO2 concentration with supported NODE modules.Lab group data-collection features (when used with LabQuest 2 or Logger Pro):• Connect multiple students to a single source via wireless Data Sharing.• Collect data from multiple sensors simultaneously.• Remote start/stop of data collection.• Over 70 compatible sensors.• Display sensor data as graphs or in a table.For more information on the Connected Science System, visit:http://www.vernier.com/cssVernier Software & Technology has over 30 years of experience in providing effective learning resources for understanding experimental data in science and math classrooms. Graphical Analysis is a part of Vernier’s extensive system of sensors, interfaces, and data-collection software for science education.
免費玩Vernier Graphical Analysis APP玩免費
免費玩Vernier Graphical Analysis App
| 熱門國家 | 系統支援 | 版本 | 費用 | APP評分 | 上架日期 | 更新日期 |
|---|---|---|---|---|---|---|
| 未知 | iOS App Store | 2.3.1 App下載 | 免費 | 2012-05-06 | 2015-06-03 |


