#1 App For Trading Ideas
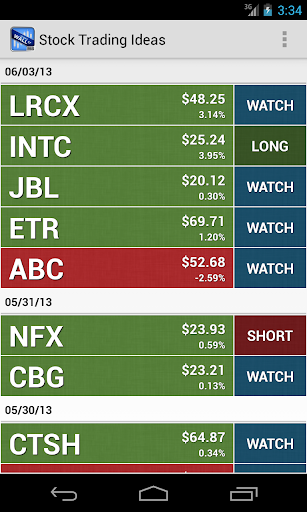
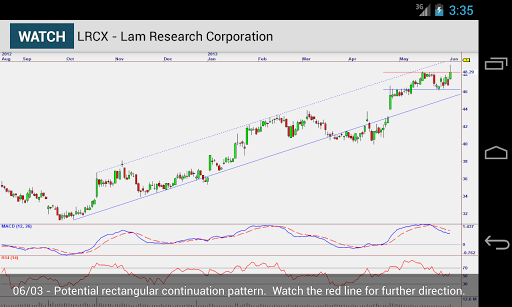
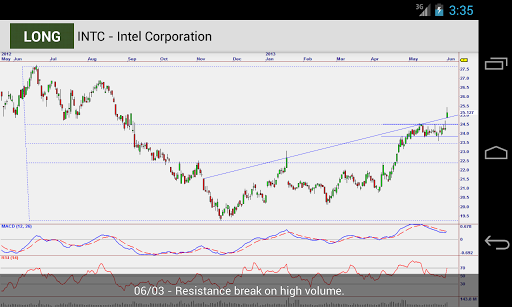
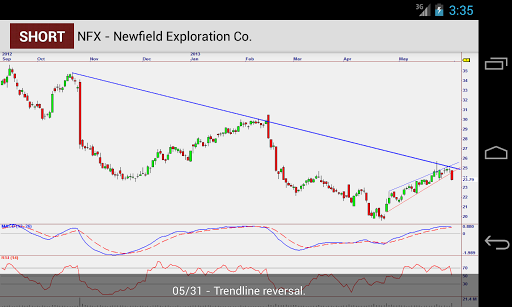
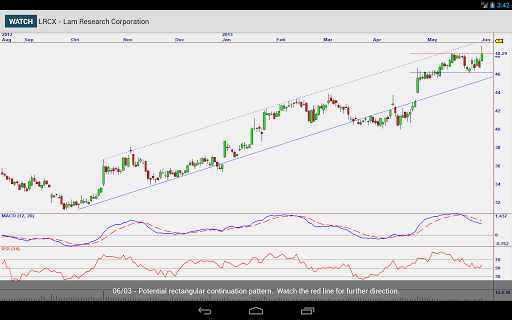
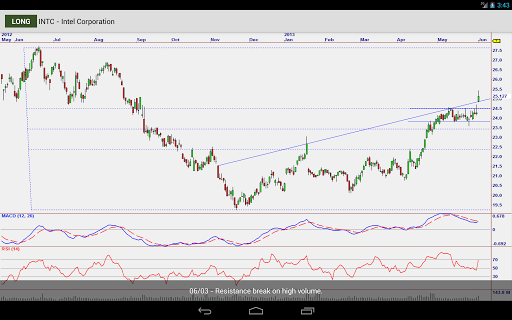
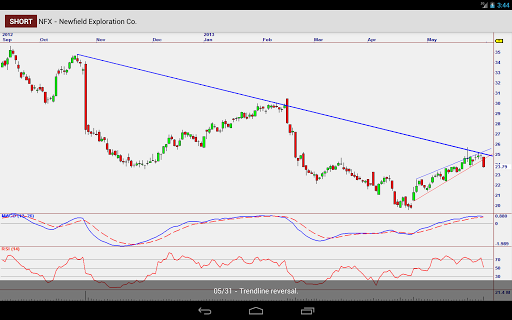
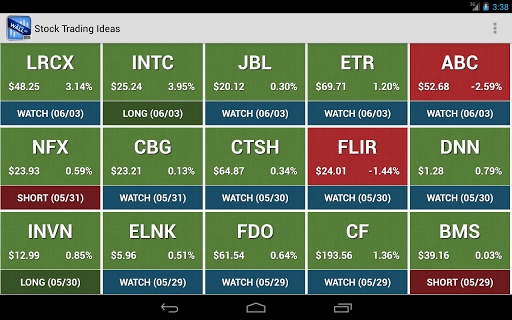
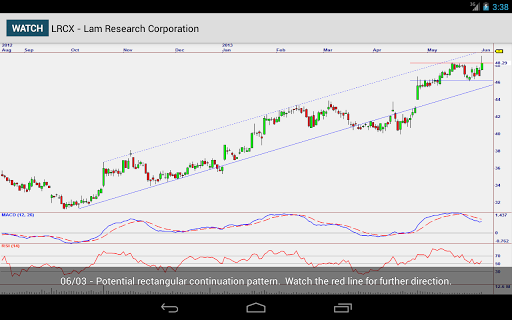
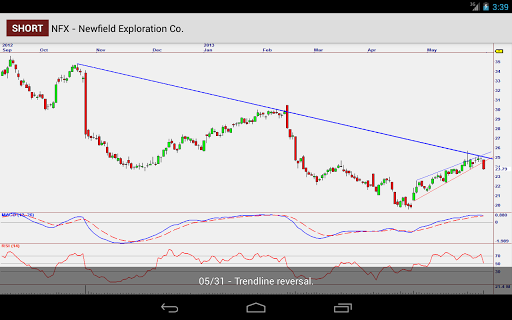
Stock Trading Ideas gives you quick access to daily updated stock picks with detailed technical analysis charts that include support and resistance levels, Fibonacci lines, classic chart patterns, Japanese Candlesticks and more.
Even though we have complex technical trading strategies that scans the stock market to generate daily and weekly “Buy” and “Sell” stock signals, our stock scanning process is not kept secret. The whole process is very straight forward and easy to follow.
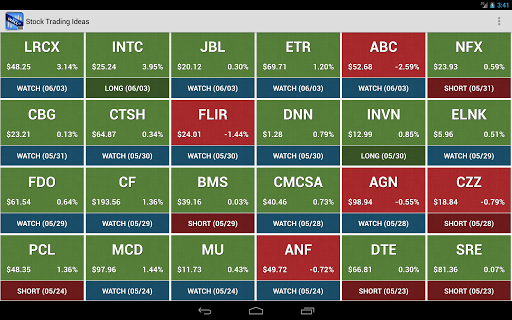
Stock Trading Ideas is an advanced stock analysis tool that filters the stock market and identifies those stocks showing greatest potential for profit. With Stock Trading Ideas, you can easily identify the most promising stock trades long before most other stock traders, giving you a key competitive advantage.
We understand that every stock investor has different levels of risk tolerance, that’s why we provide detailed technical stock charts with relevant technical indicators so that you can make your own stock investment decision if different than ours.
Step 1: Stock Market direction forecast
Step 2: Filtering stocks for technical conditions: All US stock market stocks and ETFs are scanned for the following technical indicators for various criteria
- Relative Strength Index (RSI)
- Stochastic Oscillator
- Moving Average Convergence Divergence (MACD)
- MACD Histogram
- Average Directional Movement (ADX)
- Bollinger Bands (BOLL)
- Commodity Channel Index (CCI)
- Moving Averages
- Volume
Step 3: Further filtering: The stock list is then scanned further for the following technical analysis techniques
- Trend lines
- Fibonacci Retracement Lines
- Divergences
- Japanese Candlesticks
- Support and resistance levels
- Consolidations
- Other stock chart patterns such as head and shoulders, flags, diamonds, triangles, double bottom, gaps, flags, pennants, etc.
Step 4: The filtered results are evaluated by us.
We don’t claim to make you rich or promise you unrealistic returns, but we promise that you will find great stock investment opportunities with real technical analysis behind it.
Description of terms:
Technical Analysis:
It is the practice of anticipating price changes of a financial instrument by analyzing prior price changes and looking for patterns and relationships in price history.
Technical Indicators: Any class of metrics whose value is derived from generic price activity in a stock or asset. Technical indicators look to predict the future price levels, or simply the general price direction, of a security by looking at past patterns.
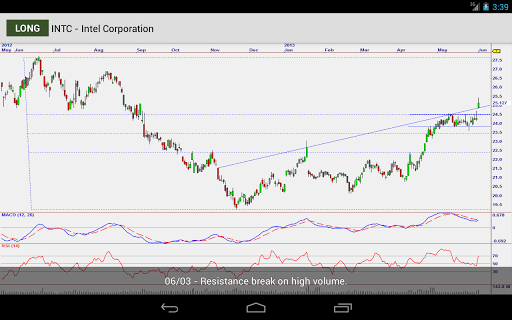
Chart Patterns: Chart Patterns are formed when a significant price activity has occurred in a financial instrument (in Stock Trading Ideas the financial instruments are stocks and ETFs).
missingSTEP apps
免費玩Stock Trading Ideas APP玩免費
免費玩Stock Trading Ideas App
Stock Trading Ideas APP LOGO

Stock Trading Ideas APP QRCode
| 熱門國家 | 系統支援 | 版本 | 費用 | APP評分 | 上架日期 | 更新日期 |
|---|---|---|---|---|---|---|
| 未知 | Android Google Play | 1.2 App下載 | USD$6.99 | 1970-01-01 | 2015-01-14 | |
| 台灣 Taiwan | Android Google Play | 1.2 App下載 | NT$210.0 | 2013-11-12 | 2015-03-26 |