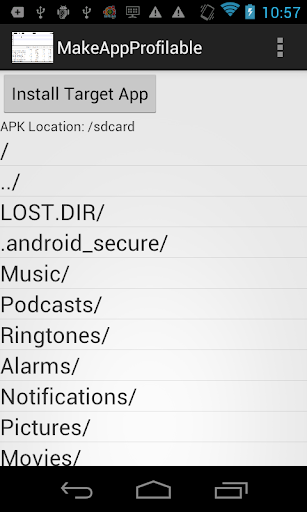
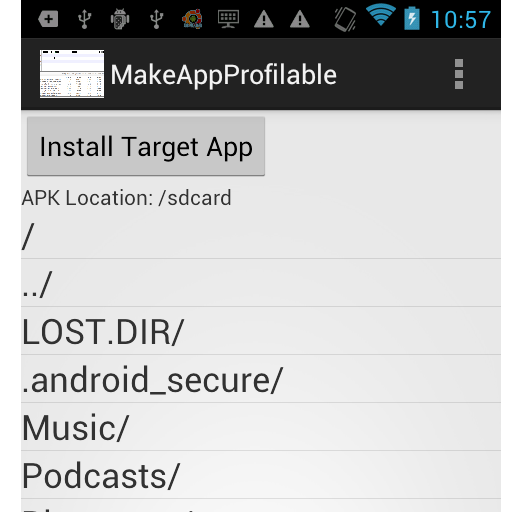
Its is hard to do code performance profiling for a app as its not Debuggable. This tool makes any retail app ready for doing client side performance code profiling. One need to download the target apk file (the app you want to profile) on to SDCARD. You can use apk share for the same to download a app from playstore . Uninstall existing target app. Open Performance Profiler app ,select the target app from sd card and click on Install . The target app will become ready for code profiling. Then you can use the Regular android Monitor or Eclipse DDMS profiler (comes as a part of android SDK) to profile a target app's client code (http://developer.android.com/tools/debugging/ddms.html)


免費玩Performance Profiler APP玩免費
免費玩Performance Profiler App
Performance Profiler APP LOGO
Performance Profiler APP QRCode
| 熱門國家 | 系統支援 | 版本 | 費用 | APP評分 | 上架日期 | 更新日期 |
|---|---|---|---|---|---|---|
| 未知 | Android Google Play | 1.0 App下載 | 免費 | 1970-01-01 | 2015-04-22 |